📊
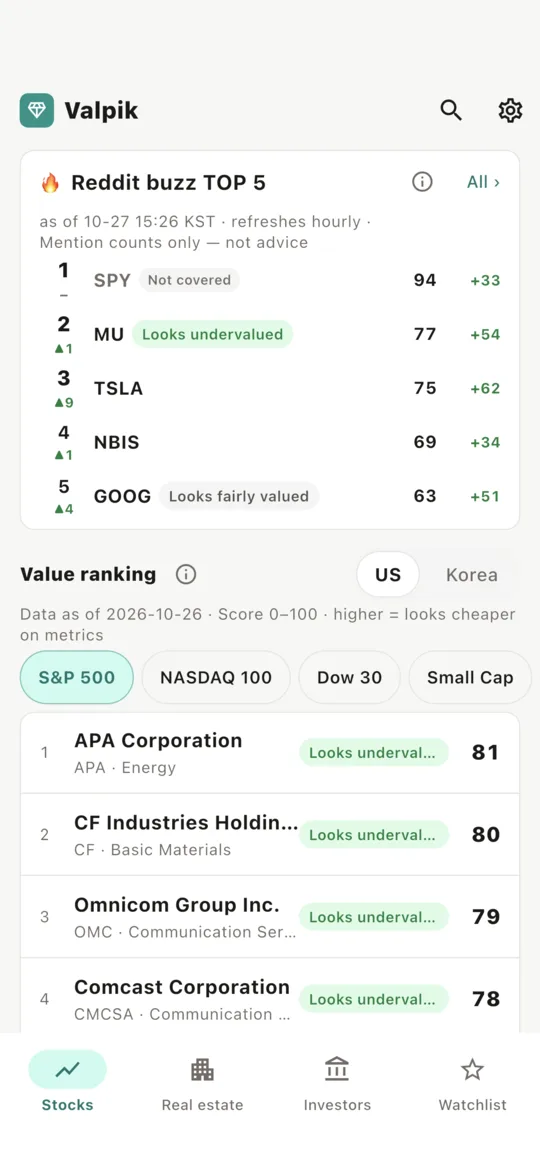
Value ranking and scores
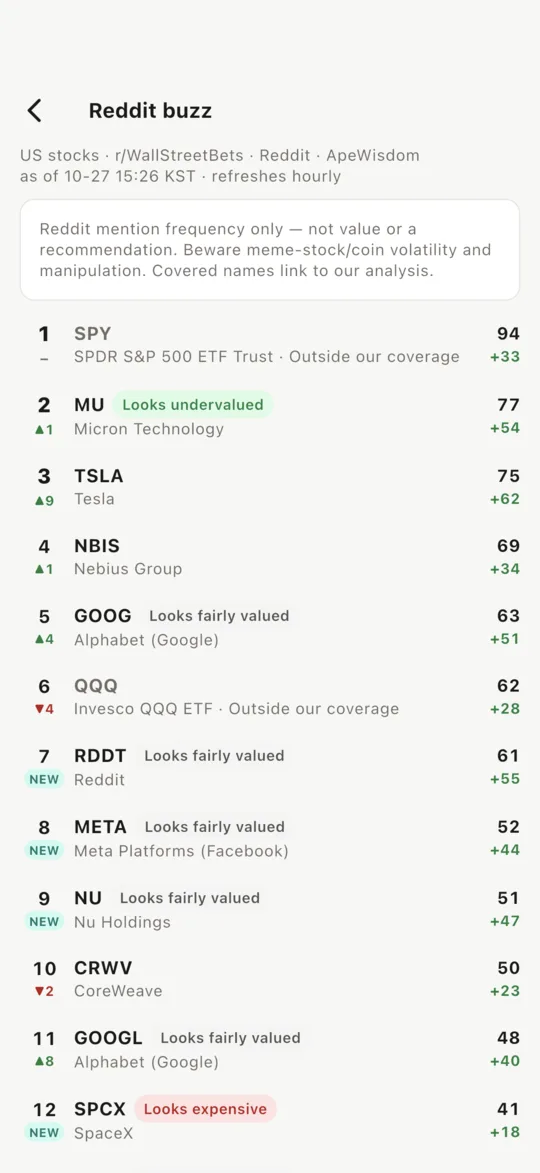
US and Korean stocks are scored on several value metrics and labeled "Looks undervalued", "Looks fairly valued" or "Looks expensive". Stocks without enough data are marked as such.
🔎
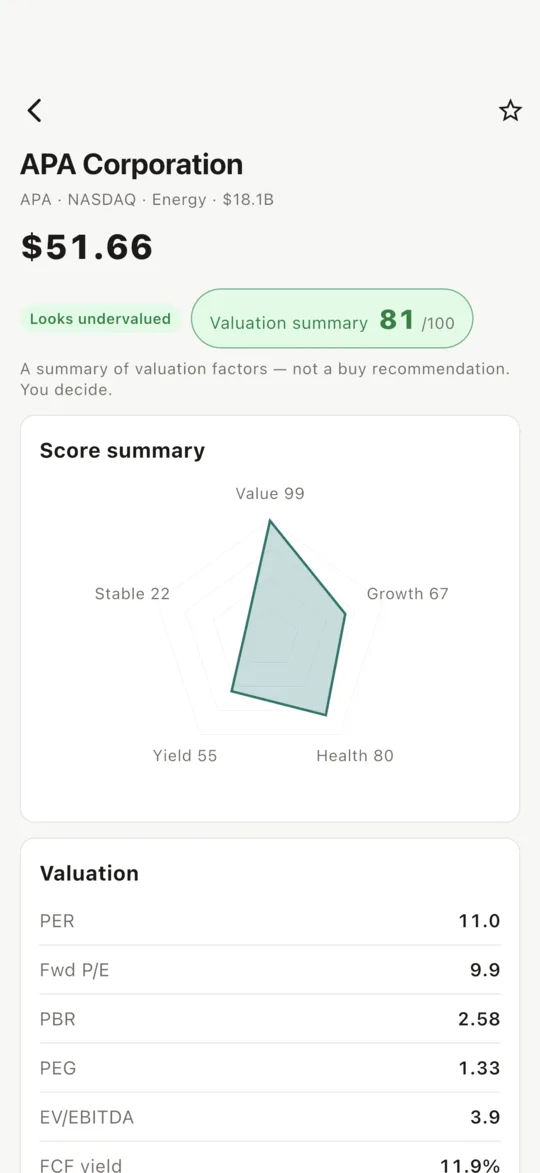
Stock details
P/E, forward P/E, P/B, PEG, EV/EBITDA and dividend, distance from the 52-week high, and a five-axis radar of value, growth, health, shareholder yield and stability on one screen.
⚠️
Value-trap warnings
Flags signals such as falling earnings or negative cash flow that may explain why a stock is cheap.
🏢
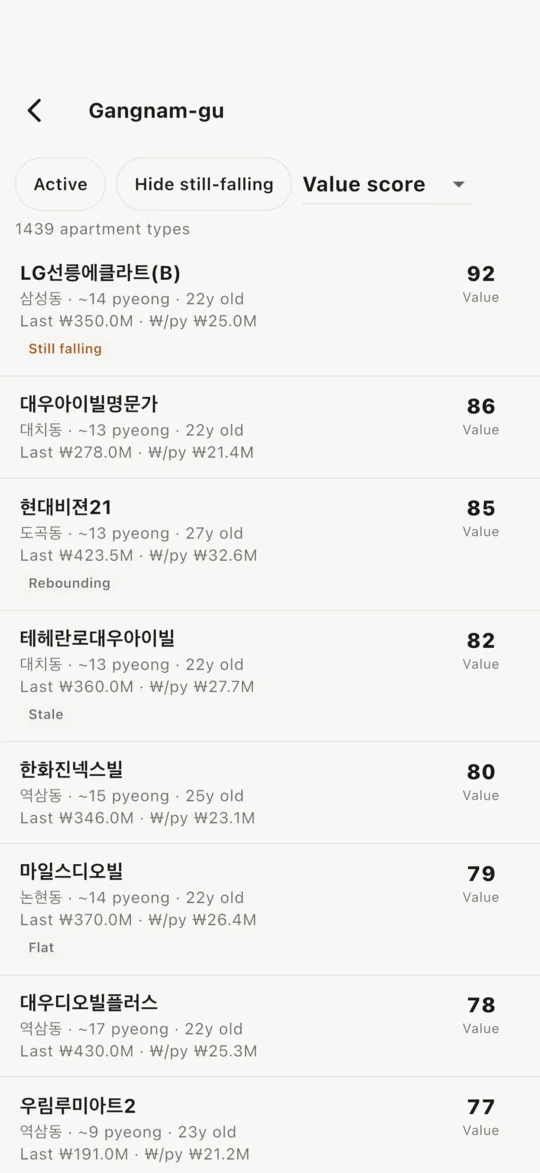
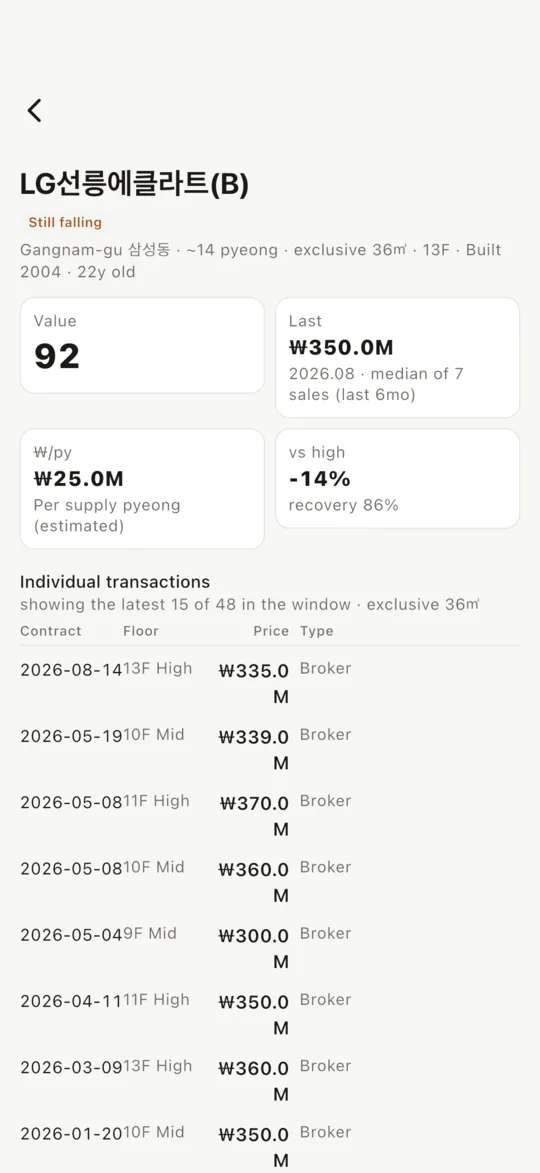
Korean apartment transactions
Complex rankings by region and actual transaction records, from Korean Ministry of Land public data.
🧾
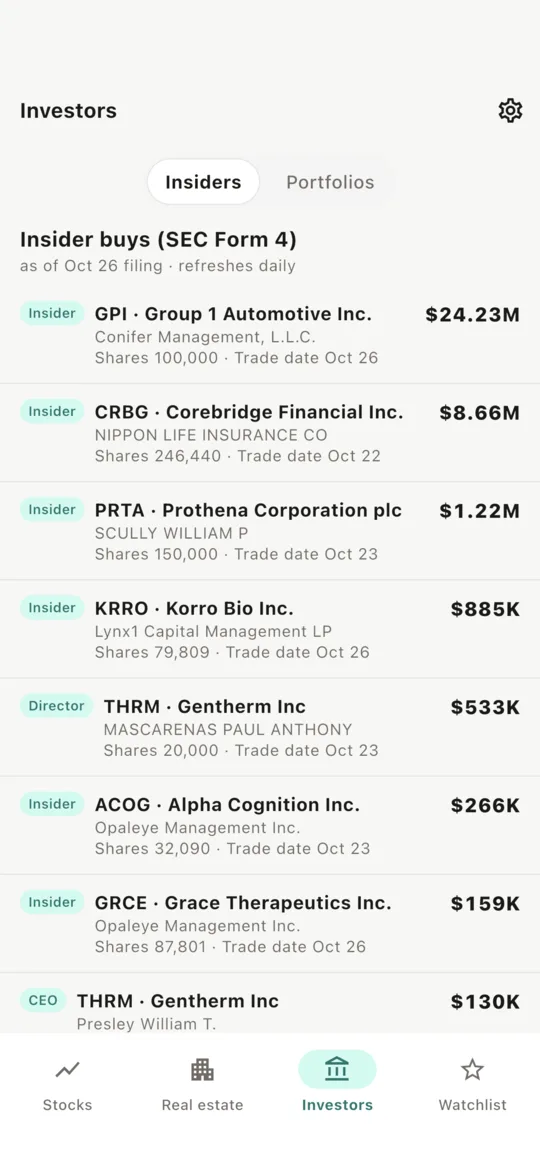
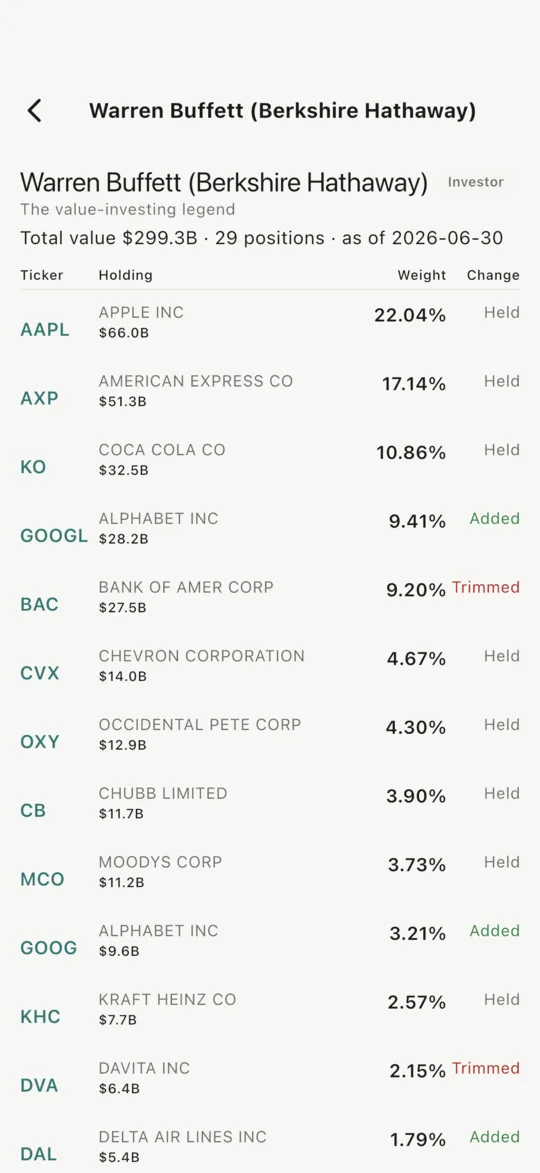
Insider buying · investor holdings
Open-market purchases by US company insiders (SEC Form 4) and the 13F holdings of well-known investors and institutions.
⭐
Watchlist
Save stocks with a star — stored only on your device, with no sign-up. Offline, it shows the last data downloaded and its date.
 Live · iOS